Well, this time, I’ll go for the tidyverse.
── Attaching core tidyverse packages ──────────────────────── tidyverse 2.0.0 ──
✔ dplyr     1.1.4     ✔ readr     2.1.4
✔ forcats   1.0.0     ✔ stringr   1.5.1
✔ ggplot2   3.4.4     ✔ tibble    3.2.1
✔ lubridate 1.9.3     ✔ tidyr     1.3.0
✔ purrr     1.0.2
── Conflicts ────────────────────────────────────────── tidyverse_conflicts() ──
✖ dplyr::filter() masks stats::filter()
✖ dplyr::lag()    masks stats::lag()
ℹ Use the conflicted package (<http://conflicted.r-lib.org/>) to force all conflicts to become errors
 [1] "album_name"          "ep"                  "album_release"
 [4] "track_number"        "track_name"          "artist"
 [7] "featuring"           "bonus_track"         "promotional_release"
[10] "single_release"      "track_release"       "danceability"
[13] "energy"              "key"                 "loudness"
[16] "mode"                "speechiness"         "acousticness"
[19] "instrumentalness"    "liveness"            "valence"
[22] "tempo"               "time_signature"      "duration_ms"
[25] "explicit"            "key_name"            "mode_name"
[28] "key_mode"            "lyrics"
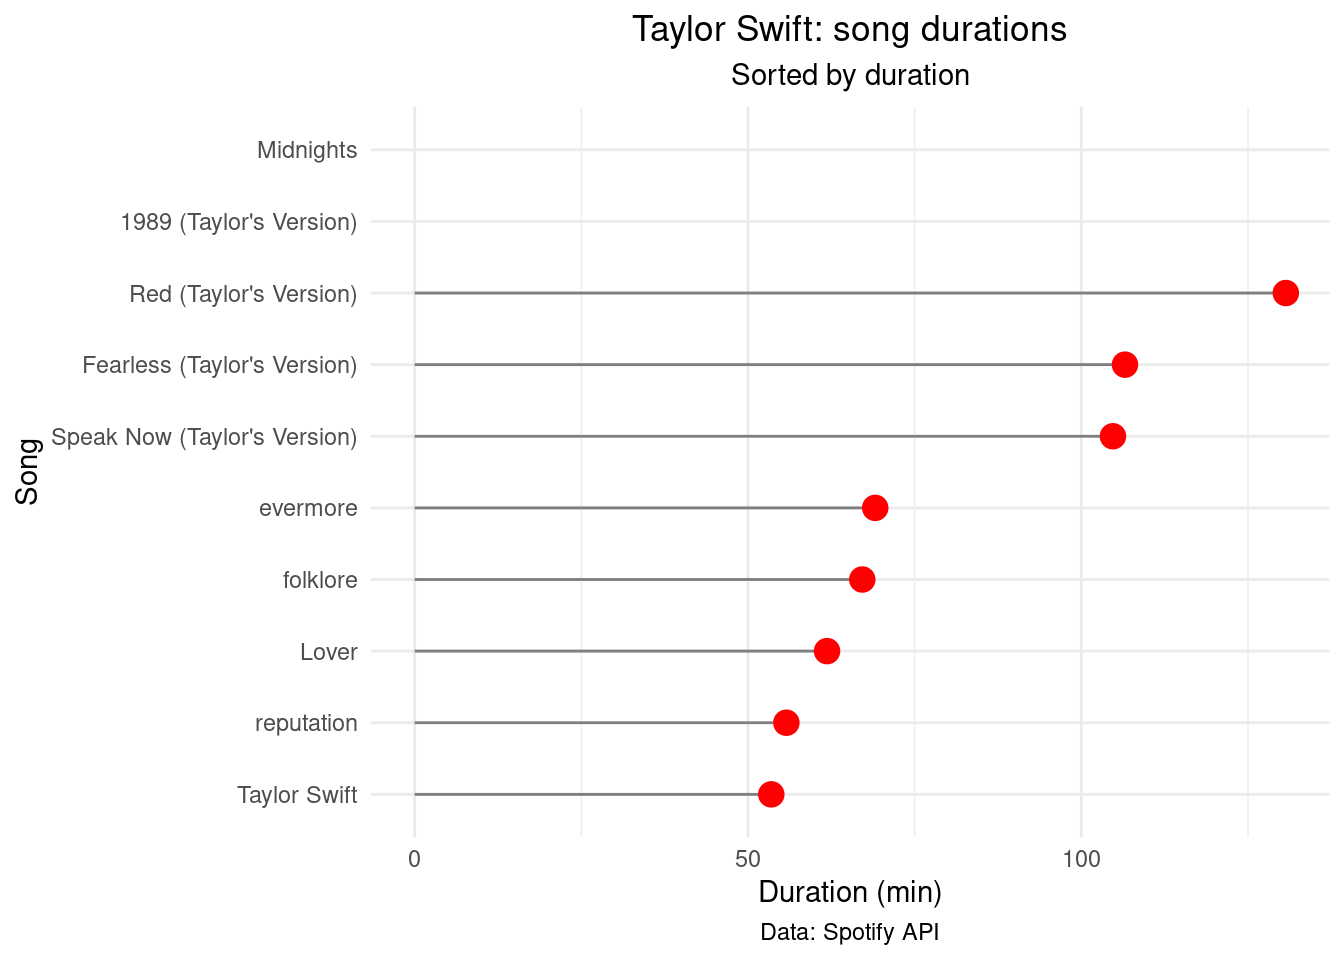
Make a lollyplot with song durations
durations <- taylor_album_songs %>%
  group_by(album_name) %>%
  summarise(duration_ms = sum(duration_ms)) %>%
  select(album_name, duration_ms) %>%
  mutate(duration_min = duration_ms / 60000) %>%
  arrange(desc(duration_min))

durations %>% ggplot(aes(x = reorder(album_name, duration_min), y = duration_min)) +
  geom_segment(aes(xend = album_name, yend = 0), color = "grey50") +
  geom_point(size = 4, color = "red") +
  labs(title = "Taylor Swift: song durations",
       subtitle = "Sorted by duration",
       x = "Song",
       y = "Duration (min)",
       caption = "Data: Spotify API") +
  theme_minimal() +
  coord_flip() +
  theme(plot.title = element_text(hjust = 0.5),
        plot.subtitle = element_text(hjust = 0.5),
        plot.caption = element_text(hjust = 0.5))
Warning: Removed 2 rows containing missing values (`geom_segment()`).
Warning: Removed 2 rows containing missing values (`geom_point()`).